
Please see the 2 attachments to be posted on the blog. Thank you.
FINAL DRAFT A 9 Pages – COCORAHS SNOWFALL MEASURING BOARDS OCTOBER 2023.pdf
JP24 SNOWBOARDS FOR NATIONAL WEATHER SERVICE SNOWFALL MEASUREMENTS.pdf
Please see the 2 attachments to be posted on the blog. Thank you.
FINAL DRAFT A 9 Pages – COCORAHS SNOWFALL MEASURING BOARDS OCTOBER 2023.pdf
JP24 SNOWBOARDS FOR NATIONAL WEATHER SERVICE SNOWFALL MEASUREMENTS.pdf
Great job on this gauge!!! 5 Stars
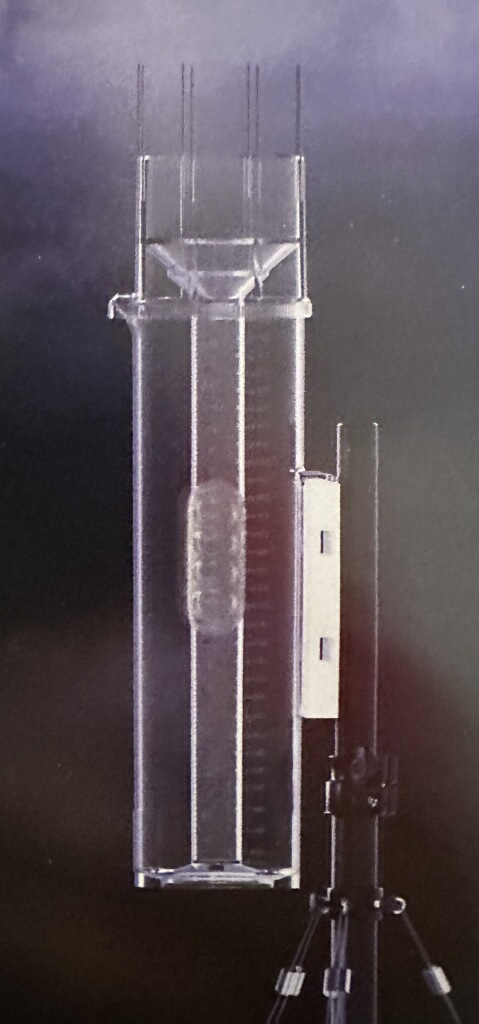
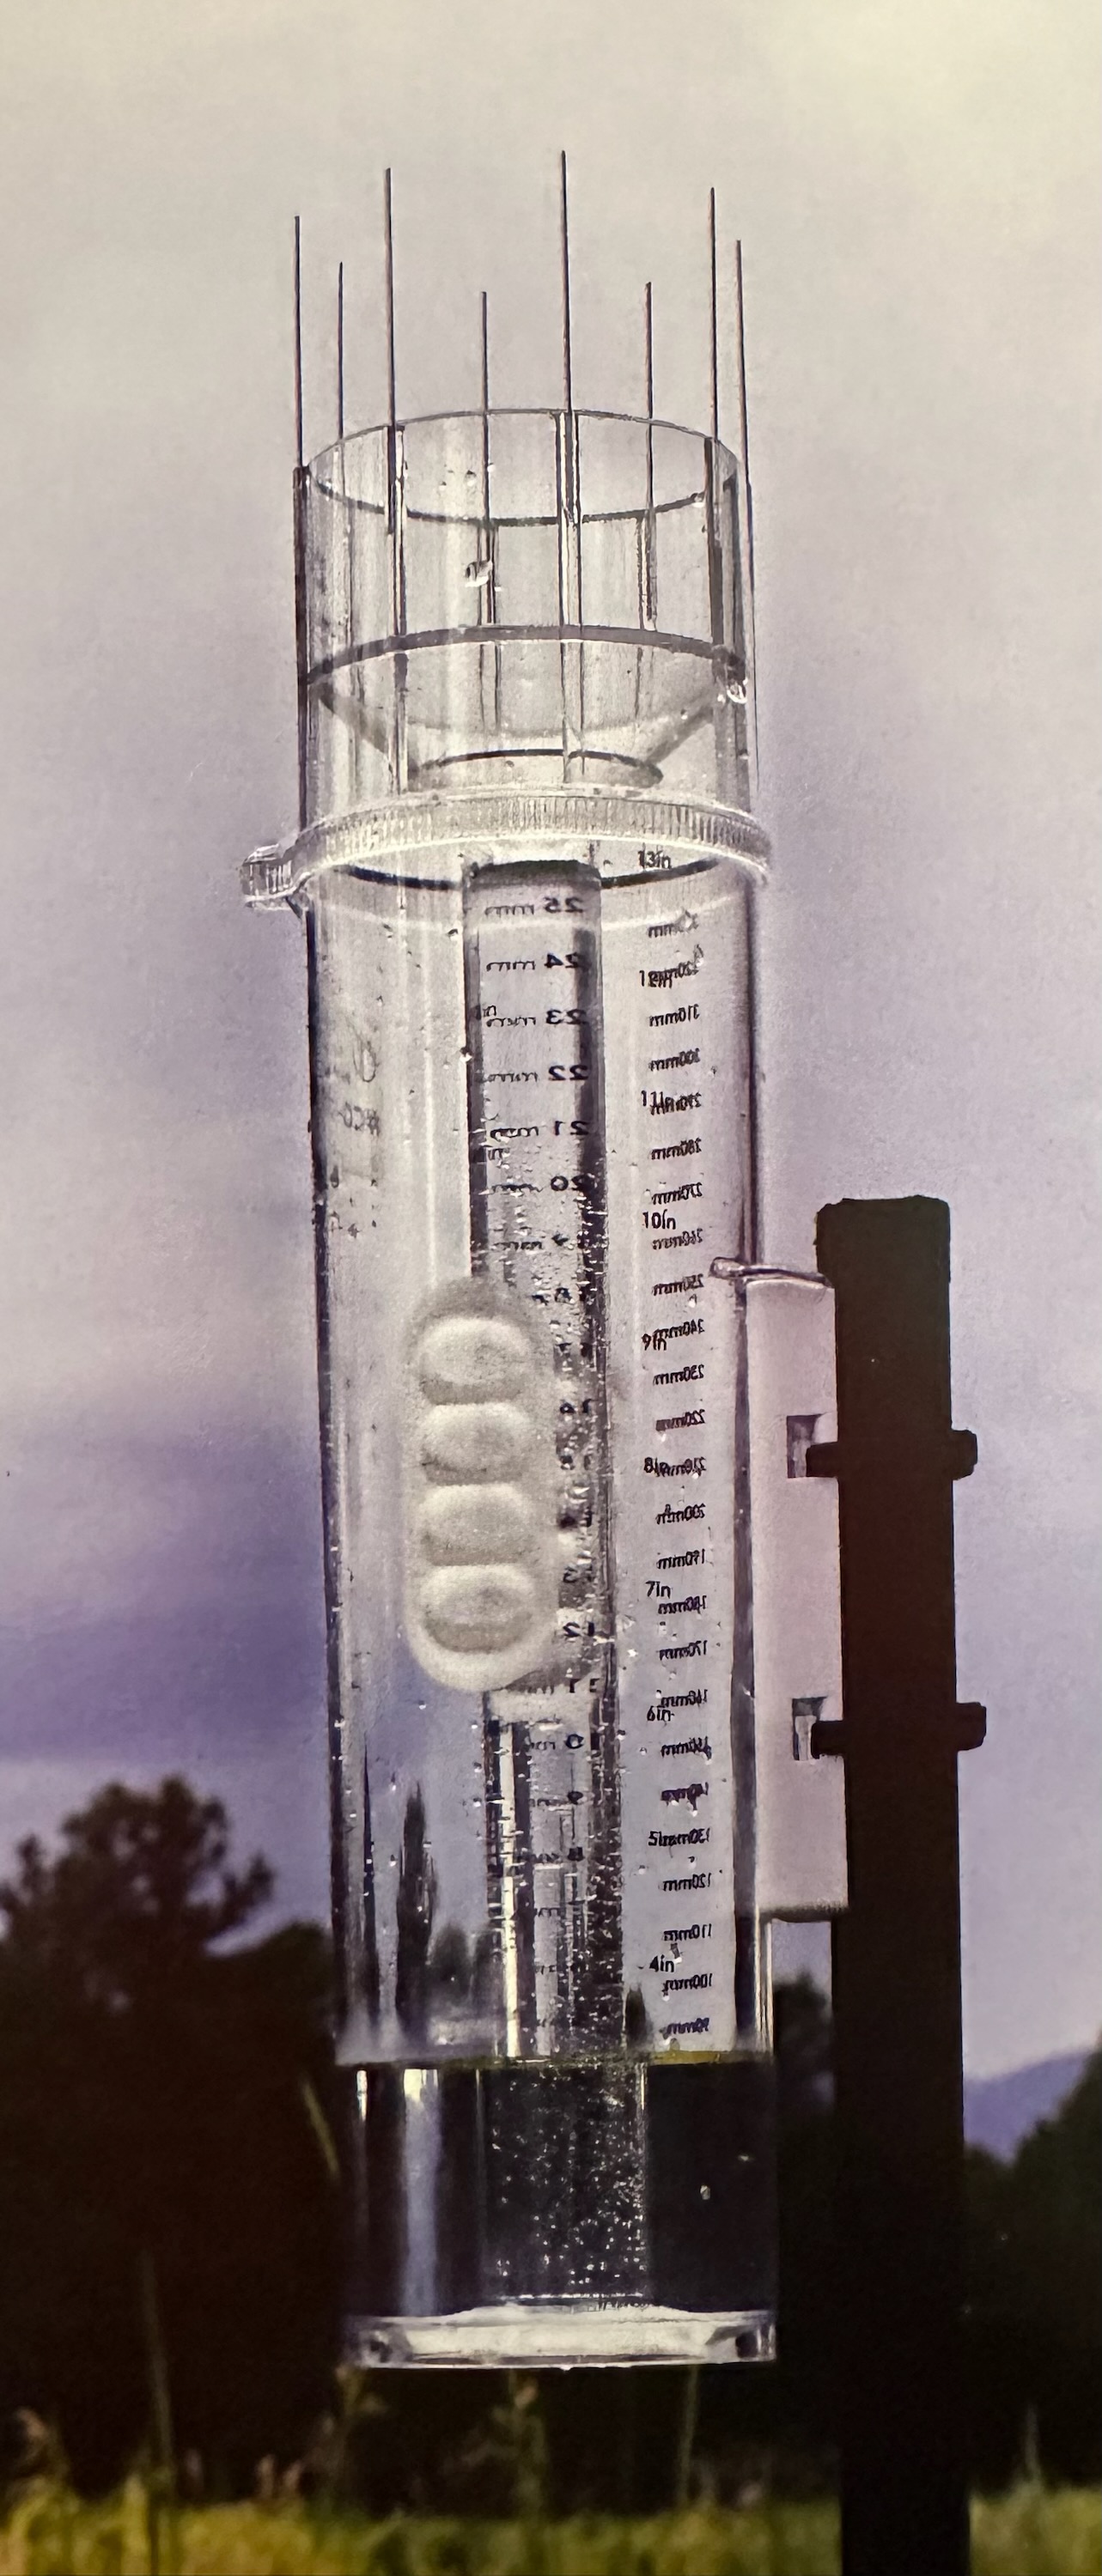
️I have had the new TROPO Precipitation Gauge for over a month now. This gauge will supersede the standard Clear-Vu gauge.
It is more robust, holds more precipitation, mounts easily, has a nicely incorporated handle and side grips for emptying the tube, when necessary, easy to read graduated precipitation amounts in both mm and inches and, those bird spikes around the top rim really help by stopping our feather friends from sitting on the rim. (You know the rest)
It even comes with a long cleaner brush to clean deep inside the tube when needed.
They put a lot of thought into this gauge, and I would HIGHLY recommend it to anyone who takes their weather readings of precipitation seriously and accurately.
Great job!
Nick Stefano
(Owner) Sussex County Weather
(President) North Jersey Weather Observers
Nick Stefano
973-222-3779


The origins of the saying “It’s raining cats and dogs” are uncertain, but there are several theories. One theory suggests that the term derives from Victorian times when street drainage was so poor that pets left on the streets would drown during rainstorms. After the rainfall, the lifeless bodies of cats and dogs scattered across the streets made it appear as though the rain had brought down an abundance of them. Another theory proposes that “cats and dogs” may come from the Greek expression cata doxa, meaning “contrary to experience or belief”. A third theory implies that the phrase is a reference to the obsolete French term catadoupe, which signifies a waterfall¹. The various explanations provide intriguing possibilities for the etymology of this curious phrase, and uncovering the true origin may continue to be a subject of debate.
I hope this helps!
Source: Conversation with Bing, 7/9/2023
(1) “Raining Cats and Dogs” | Origin and Meaning – Grammar Monster. https://www.grammar-monster.com/sayings_proverbs/raining_cats_and_dogs.htm.
(2) Idiom – It’s Raining Cats And Dogs – Deep English. https://deepenglish.com/lessons/its-raining-cats-and-dogs/.
(3) “It’s raining cats and dogs.” How did this phrase originate?. https://wgntv.com/weather/weather-blog/its-raining-cats-and-dogs-how-did-this-phrase-originate/.
(4) How did the phrase ‘it’s raining cats and dogs’ originate? – wqad.com. https://www.wqad.com/article/weather/raining-cats-and-dogs/526-cd06b836-e932-44b8-bb12-b6f8ddbab6c9.
(5) What is the origin of the phrase “it’s raining cats and dogs?”. https://www.loc.gov/everyday-mysteries/item/what-is-the-origin-of-the-phrase-its-raining-cats-and-dogs/.
Photographing summer weather can be a delightful experience. Here are some tips to capture the essence of this vibrant season:
Choose the right time: The golden hour, which occurs during the early morning and late afternoon, offers soft and warm light that can enhance your summer photos. Take advantage of this magical time for your outdoor shots.
Highlight the colors: Summer is known for its vivid and vibrant colors. Look for bright flowers, lush greenery, and vibrant blue skies to add a pop of color to your photographs. Experiment with different angles and perspectives to capture the essence of summer.
Use water as a reflective surface: Summer brings opportunities to capture stunning reflections on water surfaces. Whether it’s a calm lake, a crystal-clear pool, or even raindrops on leaves, incorporating water elements can add depth and interest to your photos.
Capture the energy: Summer is a season filled with joy and energy. Look for opportunities to photograph people engaged in summer activities, such as playing sports, enjoying picnics, or splashing in the waves. Candid shots can beautifully capture the spirit of the season.
Capture the details: From ice cream cones to colorful umbrellas, summer is full of unique details that evoke a sense of nostalgia. Don’t forget to zoom in and capture these small moments that make summer so special.
Embrace the sunshine: Summer is the perfect time to experiment with backlighting. Position your subject against the sun to create a warm glow and silhouettes. This technique can add a dreamy and nostalgic atmosphere to your photos.
Don’t forget about the weather: Summer weather can be dramatic with thunderstorms, rainbows, and breathtaking cloud formations. Keep an eye on the forecast and be prepared to capture these beautiful natural phenomena.
Remember, the key to great photography lies in practice and experimentation. So grab your camera, embrace the summer vibes, and let your creative instincts guide you. Happy shooting!
Now that your content block is filled with ideas, you can start capturing the magic of summer through your lens. Enjoy your photography journey!
Join us for meteorologist Dave Toleris as he’ll be discussing hurricane tracks and more!
Dave Dabour is inviting you to a scheduled Zoom meeting.
Topic: NJWO May 2022 Meeting
Time: May 12, 2022 07:00 PM Eastern Time (US and Canada)
Join Zoom Meeting
https://us06web.zoom.us/j/89791045625?pwd=cHFlMFZhTG84T0RtU2xheGYzSWk2dz09
Meeting ID: 897 9104 5625
Passcode: 754288
One tap mobile
+13126266799,,89791045625#,,,,754288# US (Chicago) +16465588656,,89791045625#,,,,754288# US (New York)
Dial by your location
+1 312 626 6799 US (Chicago)
+1 646 558 8656 US (New York)
+1 301 715 8592 US (Washington DC)
+1 346 248 7799 US (Houston)
+1 720 707 2699 US (Denver)
+1 253 215 8782 US (Tacoma)
Meeting ID: 897 9104 5625
Passcode: 754288
Thursday March 10, 2022 7pm East.
NWS Meteorologist Walt Drag!
Topic: OPEN Line Thursday!
By Popular Demand… Weather Q&A!
zoom.njwo.org
Thursday February 10, 2022 7 pm EST
Meteorologist Scott McKim!
Scott will be discussing his NJ Roots, Teaching Weather in Alaska, and his work with NY MESONET.Living in Saranac, NY. Scotts Office is on the Summit of Whiteface Mt!!!
See Page 31 of the Weather Shelter for Scott’s Bio.
zoom.njwo.org
SEPTEMBER 2021 MONTHLY SUMMARY ROCKVILLE 2.8 WNW MARYLAND
by Kevin Shaw, Observer
September 2021 had above average temperatures with above normal
precipitation amounts that were wholly between the 1st and 23rd.
The wettest two days of the month were on the very beginning (on the
1st with 1.88”) and the end (on the 23rd with 2.07”). The last week of
the month (24th through the 30th) was totally dry. The rainfall on
the 1st was from tropical storm Ida, and on the 23rd the heavy rain
was from overnight thunderstorms.
My maximum temperature average (77.7°) was 0.6° above normal
but my minimum temperature average (61.6°) was 4.4° above
normal, resulting in the mean temperature average of 69.7° turning
out to be 2.6° above normal. My total precipitation of 5.39" was 1.39”
above the normal September value for my station of 4.00”. There were
10 days with measurable precipitation, all between the 1st and 23rd.
There was only one relatively “cool” day in September with max temps
below 70° (68.4° on the 29th). There were only 9 days with minimums
below 60° and none below 50°. There were 9 days with max temps of
80° or more, topped off by the 86.4° maximum value on the 15th.
There was a somewhat significant 5 day period between
the 12th and the 16th with max temperatures of 80° or more, but no
90° maximums were recorded during the entire month.
The monthly maximum daily precipitation amount of 2.07" was reached
on the 23rd with one other notable one day event of 1.88” on the 1st.
The extreme barometric pressure readings of the month were rather
muted once again. The lowest value of 29.49” fell on the 1st as Tropical
Storm Ida was making a wet but not very windy visit to our area. The
highest value of 30.32” occurred almost three weeks later on the 20th
in the middle of a minor 4 day dry spell.
The highest dew point temperature reached during the month was 76°
recorded on the 1st courtesy of tropical storm Ida. There were 13 days
with dew point values of 70° or greater, including 6 days in a row
between the 13th and the 18th. The lowest dew point value of 45°
occurred on the 29th during our coolest max temperature day of
the month. There were 5 days during the month with dew points in
the 40s, mostly near the end of the month.
September had 7 cloudy, 17 partly cloudy, and 6 clear/sunny days,
pretty much average for a wetter than normal month. There were
156 cooling degree days and 17 heating degree days during the month.
There were only 3 foggy and 2 windy days (30+ MPH) with a very
modest monthly PWG value of 34 MPH from the SW on the 22nd.
Most days during the month had PWG values in the moderate teens
(12) and twenties (16) range.
My maximum temperature frequencies included 9 days over 80°,
20 days between 70° and 79°, and 1 day below 70°. On the minimum
temperature frequency side of things, there were 11 days below 60°,
17 days between 60.0° and 69°, and 2 days of 70° or more. The
coolest daily maximum temperature day was 68.4° on the 29th while
the warmest daily minimum temperature day of 70.9° was reached
on the 22nd.
The diurnal range daily monthly average was 16.0° (- 3.9°).
Our greatest daily range of temperature was 23.6° on the 27th
(77.6°- 54.0°). We had a total of 5 days with daily ranges above 20°.
Our lowest range of temperature was 5.8° (72.6°- 66.8°) on the 5th.
There were only a total of 3 days with daily ranges under 10° during
September.
September 2021 was moderately wet except for the dry last week of
the month with above normal temperatures but no above 90° max
temperature hot periods the entire month. Groundwater reserves
are currently in fairly good shape from a wetter September and
moderately wet October. Fall foliage changes have been slow to
develop once again during October but the last week or so has really
started to “color us up” in time for Halloween and heading into the
November holidays. The tropics have really shut down the last half
of October with a few moderate more winter-like nor-easters actually
developing the past few weeks. Will this foretell of a more active,
snowy winter ahead under a developing La Nina pattern?
Only time will tell. Stay tuned!
SEPTEMBER 2021 – ROCKVILLE 2.8 WNW MARYLAND
SUMMARY STATISTICS
Average high temperature 77.7° (+0.6°)
Average low temperature 61.6° (+4.4°)
Mean temperature 69.7° (+2.6°)
High temperature for the month (date) 86.4° (15)
Low temperature for the month (date) 50.9° (24)
Precipitation 5.39" (+1.39“)
Greatest daily amount (date) 2.07" (23)
Greatest storm total (dates) 2.46” (22-23)
2021 year-to-date precipitation total 30.47" (-1.12”)
Highest barometric pressure (date) 30.32 (20)
Lowest barometric pressure (date) 29.49” (1)
Peak wind gust (date/direction): 34 (22/SW)
(USG data across the street)
Heating degree days for the month: 17
Cooling degree days for the month: 156
Greatest diurnal range (date): 23.6° (27)
Least diurnal range (date) 5.8° (5)
Number of days:
Fog 3
Windy 2
Thunder 2
Hail 0
Cloudy 7
Partly Cloudy 17
Sunny/Clear 6
Max temp = 80° 9
Min temp < 60° 9
Precip = 0.01” 10
AUGUST 2021 MONTHLY SUMMARY ROCKVILLE 2.8 WNW MARYLAND
by Kevin Shaw, Observer
August 2021 had above average temperatures with
significantly above normal precipitation amounts
that were concentrated between the 9th and 28th.
As such there was only one monthly dry spell
starting on the 2nd and carrying through the 8th.
There were numerous wet spells at most other times,
most notably from the 9th-11th (1.63”) and from
the 25th-28th when daily thunderstorm action each
day totaled 1.07”.
My maximum temperature average (85.4°) was 1.1°
above normal but my minimum temperature average
(69.8°) was 5.4° above normal, resulting in the
mean temperature average of 77.6° turning out to
be 3.3° above normal. My total precipitation of
6.06" was 2.89” above the normal August value for
my station of 3.17”. There were 15 days with
measurable precipitation and 1 day with trace
amounts, most all between the 9th and 28th.
There were four relatively “cool” days in July
with max temperatures below 80° (74.4° on the
1st, 77.9° on the 2nd and 3rd, and 76.8° on the
7th – only the 1st was wet (0.32”) and the other
3 days were dry). There were only 4 days with
minimums below 65 and none below 60. There were
8 days with max temps of 90° or more, topped off
by the 94.4° max on the 12th. There was a
significant 5 day period between the 9th and the
13th with max temperatures of 90° or more.
The monthly maximum daily precipitation amount
of 1.02" was reached on the 10th with other
notable one day events of .81” on the 13th,
.97” a week later on the 20th and .70” a week
later on the 27th when we had our strongest
thunderstorm of the month when a greatest PWG
of the year was recorded (63 MPH from the W at
1509). Fortunately the power and other
accessories did not fail as a result of this
storm like what happened with the storm back
in July.
The extreme barometric pressure readings of
the month were rather muted but occurred 3
days of each other. The lowest value of 29.79”
on the 31st as Tropical Storm Ida was
approaching the area but rain held off till
early on September 1. The highest value of
30.24” occurred only a few days earlier on
the 28th at the end of our prolonged wet
spell during much of the month.
The highest dew point temperature reached
during the month was 80° recorded on the 13th
on a day with a significant thunderstorm
later in the day. There were 26 days with
dew point values of 70° or greater. The
lowest dew point value of 57° occurred on
the 2nd during our coolest period of the
month. There were only 4 days during the
month with dew points in the 50s, all
between the 2nd and the 5th.
August had 10 cloudy, 19 partly cloudy,
and 2 clear/sunny days, roughly about
normal for August. There were 392 cooling
degree days and 0 heating degree days
during the month. There were 5 foggy days
but only 4 windy days (30+ MPH but only 1
of 40+ MPH but it was a doozy as previously
detailed on the 27th ). Most days during the
month had PWG values in the moderate teens
(12) and twenties (15) range.
My maximum temperature frequencies included
8 days over 90°, 19 days at or over 80°, and
4 days between 70° and 79°. On the minimum
temperature frequency side of things, there
were 9 days between 60.0° and 69°, and 22
days of 70° or more. The coolest daily max
temperature day was 74.4° on the 1st while
the warmest daily min temp day of 74.2° was
reached on the 18th.
The diurnal range daily monthly average was
15.6° (- 4.3°). Our greatest daily range of
temperature was 23.7° on the 11th (93.9°-
70.2°). We had a total of 6 days with daily
ranges above 20°. Our lowest range of
temperature was 6.7° (74.4°- 67.7°) on the
1st , our coolest day of the month. There
were a total of 6 days with daily ranges
under 10° during August.
August 2021 was generally wet with only two
notable hot periods but still no real
extremes save for the very windy
thunderstorm on the 27th. Groundwater
reserves are currently in fairly good
shape from a wetter August and moderately
wet September so far. Extreme heat has
stayed away for the most part, keeping
lawns and gardens fairly green. The tropics
have flared up a bit on occasion, but have
been pretty quiet as far as our immediate
area goes. We shall see what, if any
activity will develop, including,
conversely, the coming of cooler fall
temperatures.
AUGUST 2021 – ROCKVILLE 2.8 WNW MARYLAND –
SUMMARY STATISTICS
Average high temperature 85.4° (+1.1°)
Average low temperature 69.8° (+5.4°)
Mean temperature 77.6° (+3.3°)
High temperature for the month (date) 94.4° (12)
Low temperature for the month (date) 60.0° (2)
Precipitation 6.06" (+2.89“)
Greatest daily amount (date) 1.02" (10)
Greatest storm total (dates) 1.63” (9-11)
2021 year-to-date precipitation total 25.08" (-2.51”)
Highest barometric pressure (date) 30.24” (28)
Lowest barometric pressure (date) 29.79” (31)
Peak wind gust (date/direction): 63 (27/W)
(USG data across the street)
Heating degree days for the month: 0
Cooling degree days for the month: 392
Greatest diurnal range (date): 23.7° (11)
Least diurnal range (date) 6.7° (1)
Number of days:
Fog 5
Windy 4
Thunder 7
Hail 0
Cloudy 10
Partly Cloudy 19
Sunny/Clear 2
Max temp = 90° 8
Min temp < 65° 4
Precip = 0.01” 15
JULY 2021 MONTHLY SUMMARY ROCKVILLE 2.8 WNW MARYLAND
by Kevin Shaw, Observer
July 2021 had above average temperatures with just a
bit drier than normal precipitation amounts that were
widely spread throughout the month with three very
modest three day dry spells. The equally modest
wettest measurable rain period of the month occurred
in a 3 day stretch between the 1st and the 3rd (0.78”).
My maximum temperature average (87.2°) was 0.8° above
normal but my minimum temperature average (69.5°) was
3.6° above normal, resulting in the mean temperature
average of 78.3° turning out to be 2.2° above normal.
My total precipitation of 3.36" was 0.49” below the
normal July value for my station of 3.85”. There were
11 days with measurable precipitation and 2 days with
trace amounts, fairly evenly distributed during the
entire month.
There were three relatively “cool” days in July with
max temperatures below 80° but barely (78.5° on the
3rd, 78.3° on the 18th and 78.9° on the 31st – only
the 3rd was wet (0.04”) and the other 2 days were
dry). There technically was 1 day with a min in the
50s (59.8°) but that statistically gets listed as a
60° reading. There were 11 days with max temps of 90°
or more, topped off by the 94.1° max on the 6th.
There was a significant 7 day period between the 11th
and 17th with max temperatures of 90° or more.
The monthly maximum daily precipitation amount of
1.28" was reached on the 17th marking the end of
that 7 day hot spell. This event was the month’s
most notable one in many regards. The thunderstorm
that hit the hardest around 1600-1630 on that day
knocked out power briefly (lightning/thunder almost
instantaneous directly overhead that when it hit I
almost jumped right out of my seat!!!) but much more
significantly knocked out the elevator service to my
apartment building, and was not restored till the next
Monday. It also fried my Cable TV connection I have
that was not restored till the following Thursday by
a Comcast technician. The peak wind gust recorded
across the street on that day at 1607 was 56 MPH,
easily the highest gust of the month, and the second
highest of the year, only surpassed by a 59 MPH PWG
back on April 30.
The extreme barometric pressure readings of the month
were rather muted and occurred 3 weeks of each other.
The lowest value of 29.76” on the 2nd occurred during
that brief 3 day brief wet period mentioned earlier
while the highest value of 30.21” occurred on the 23rd
in the middle of a brief 3 day relatively pleasant,
dry weather period.
The highest dew point temperature reached during the
month was 78° recorded on 2 separate days (7th and
13th). There were 25 days with dew point values of
70° or greater. The lowest dew point value of 52°
occurred on the 22nd during that highest pressure of
the month period previously mentioned. There were a
total of 8 days during the month with dew points in
the 50s, including 6 of the last 10 days of the month.
July had 5 cloudy, 25 partly cloudy, and only 1 really
clear/sunny day, about what to expect for a dry summer
month. We had a few days (20,21) with haze/smoke from
the Western Wildfires and two days affected by the weak
remnants of Tropical System ELSA on the 8th and 9th
(only 0.67” rain and a 32 MPH PWG from the N on the
9th). There were 414 heating degree days and 0 cooling
degree days during the month. There were 3 foggy days
but only 4 windy days (30+ MPH but only 1 of 40+ MPH
but it was a doozy as previously detailed on the 17th).
Most days during the month had PWG values in the
moderate teens (12) and twenties (15) range.
My maximum temperature frequencies included 11 days
over 90°, 17 days at or over 80°, and 3 days between
70° and 79°. On the minimum temperature frequency side
of things, there was 1 day < 60°, 12 days between 60.0°
and 69°, and 18 days of 70° or more. The coolest daily
max temperature day was 78.3° on the 18th while the
warmest daily min temp day of 74.9° was reached on the
12th and 13th.
The diurnal range daily monthly average was 17.7°
(-2.8°). Our greatest daily range of temperature was
23.5° on the 6th (94.1°- 70.6°). We had a total of 7
days with daily ranges above 20°. Our lowest range of
temperature was 9.2° (78.3°- 69.1°) on the 18th , the
day after our big thunderstorm day of the month.
It was the only July day with a daily range under 10°.
July 2021 was generally dry with one notable hot period
but still no real extremes save for the thunderstorm on
the 17th. Groundwater reserves are currently in fairly
good shape from a wet August so far. Extreme heat has
stayed away for the most part, keeping lawns and gardens
fairly green. The tropics have flared up a bit recently,
but have been pretty quiet as far as our immediate area.
We shall see what, if any activity will develop.
JULY 2021 – ROCKVILLE 2.8 WNW MARYLAND
SUMMARY STATISTICS
Average high temperature 87.2° (+0.8°)
Average low temperature 69.5° (+3.6°)
Mean temperature 78.3° (+2.2°)
High temperature for the month (date) 94.1° (6)
Low temperature for the month (date) 59.8° (3)
Precipitation 3.36" (-0.49“)
Greatest daily amount (date) 1.28" (17)
Greatest storm total (dates) 1.28” (17)
2021 year-to-date precipitation total 19.02" (-5.40”)
Highest barometric pressure (date) 30.21” (23)
Lowest barometric pressure (date) 29.76” (2)
Peak wind gust (date/direction): 56 (17/W)
(USG data across the street)
Heating degree days for the month: 0
Cooling degree days for the month: 414
Greatest diurnal range (date): 23.5° (6)
Least diurnal range (date) 9.2° (18)
Number of days:
Fog 3
Windy 4
Glaze/Sleet/Snow 0
Thunder 5
Cloudy 5
Partly Cloudy 25
Sunny/Clear 1
Max temp = 90° 11
Min temp =< 65° 4
Precip = 0.01” 11
